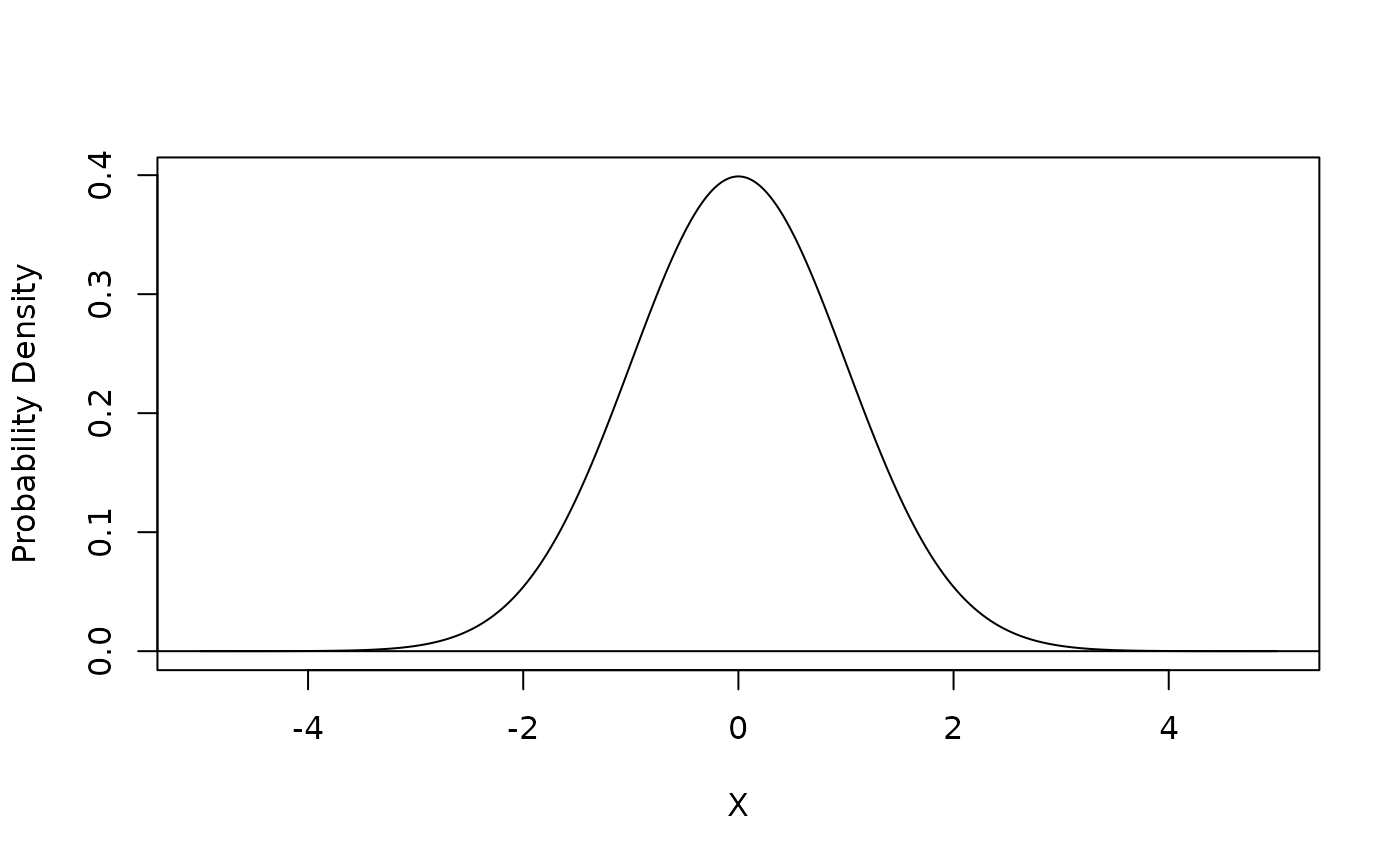
Plots a Normal distribution
plot_norm.RdPlots a Normal distribution
Usage
plot_norm(
  mean = 0,
  sd = 1,
  from = NULL,
  to = NULL,
  n = 1000,
  add = FALSE,
  type = "l",
  xlab = expression(X),
  ylab = "Probability Density",
  xlim = NULL,
  ...
)
Arguments
- mean
the mean of the distribution.
- sd
the standard deviation of the distribution.
- from
the starting x-value for the plot. If NULL, it will be set to -5 sd from the mean.
- to
the ending x-value for the plot. If NULL, it will be set to the mean plus 5 sd.
- n
the number of points to use in the plot. Default is 1000.
- add
whether to add the curve to an existing plot (TRUE) or create a new plot (FALSE). Default is FALSE.
- type
the type of plot to create. Default is "l" for a line plot.
- xlab
the label for the x-axis. Default is expression(chi^2).
- ylab
the label for the y-axis. Default is "Probability Density".
- xlim
the limits for the x-axis. If NULL, it will be set to c(from, to).
- ...
additional arguments to be passed to the curve function.